Introduction
At this page, you can analyze and summarize the administrative information in a single screen using the list, pivot analysis, and chart functions. The summary is interactive because it is derived from a comparison between customizable variables.
Menu path
Financial/Reports/Graph/Bank/Cash
Roles & rights
To view the graph for financial balance, function right 485 – View graphical overview for balance sheet is required. Users with the General Manager and Controller roles have this function right.
For more details on what you can do with function rights or levels, go to System/Setup/Security/Function rights, select the required module, and then click on the relevant ID. To find out the functions you can perform with a particular role, go to System/Setup/Security/Roles, type in the description, click Refresh and then click the required link under the Role column.
Button
Show
Click this to display the report according to the defined criteria.
Note: Once you have clicked this button, the name of the button will change to Refresh.
Refresh
Click this to update the result according to the defined criteria.
Reset
Click this to clear the defined criteria so that you can start a new search.
Close
Click this to exit.
Description

Criteria section
Division
Select a division to view the report. Then, click the browser icon to select the corresponding information for the different divisions. For more information, see Creating Division and Creating and Modifying Subgroups.
Note: The drop down list box represents division groups and division. If you choose the division value, then the browser itself will show all the divisions available.
If you choose division groups (Layout 1, Layout 2, and others) then the browser will show all the subgroups.
To be able to view the division group, you need to have corporate and strategic group levels. If not, the application will take your current division.
Currency
Select a currency linked to the data you want to display. For more information, see Modifying Currency.
Year
Select the year of the data you want to display. For more information, see Creating Financial Year.
Balance
Select the type of balance you want to display. You can choose from Bank/Cash, AP (accounts payable), or AR (accounts receivable). If you leave this box blank, all types of balances will be displayed.
Analysis
 List - Click this to see a group of filters for summarizing requests from a list. Click this again to reset the displayed report.
 Pivot analysis - Click this to see a group of filters for summarizing requests by different variables using a pivot analysis. Click this again to reset the displayed report.
 Chart - Click this to see a group of filters for summarizing requests in charts. Click this again to reset the displayed report.
If you click  List at Analysis, you will see the following fields:
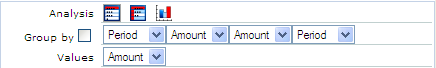
Group by
You can group the list of requests by a maximum of four different groupings selected from the boxes.
Note: Selecting the check box will overwrite the selection from the boxes.
Values
Select a value to see the corresponding value of the listed requests.
If you click  Pivot analysis at Analysis, you will see the following fields:
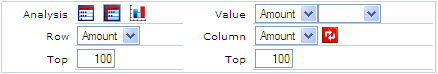
Value
Select a maximum of two variables to be used for comparison.
Row and Top
Select the variable to be used for the X-axis and the number of rows to be displayed.
Column and Top
Select the variable to be used for the Y-axis and the number of columns to be displayed.

Click this to switch the values between the row and column.
If you click  Chart at Analysis, you will see the following fields:
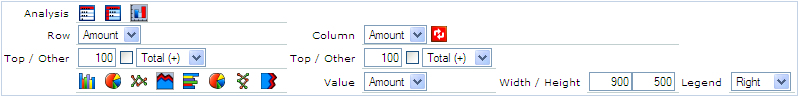
Row and Top/Other
Select the variable to be used for comparison at Row and the number of rows to be displayed at Top. If the total number of available information is more than the defined rows at Top, you can lump the balance rows under Other by selecting the check box. For example, select Total (+) or Total (-) to display the totals in ascending or descending order respectively.
Column and Top/Other
Select the variable to be used for comparison at Column and the number of columns to be displayed at Top. If the total number of available information is more than the defined columns at Top, you can lump the balance columns under Other by selecting the check box. For example, select Total (+) or Total (-) to display the totals in ascending or descending order respectively.

Click this to switch the values between the row and column.
 Bar (Vertical),
  Pie (Vertical),
  Line (Vertical),
  Region (Vertical)
Select the required option to display the results in the various vertical formats.
 Bar (Horizontal),
  Pie (Horizontal),
  Line (Horizontal),
  Region (Horizontal)
Select the required option to display the results in the various horizontal formats.
Value
Select the variable to be displayed in the organization chart.
Width / Height
Select the width and height of the chart.
Legend
Select Right, Bottom, Left, or Top to position the legend at the corresponding location in the chart. Select None if you do not want any legend in the chart. This is not applicable in the Pie format.
Related document