Introduction
At this screen, you can analyze and summarize the financial information in a single screen using the list, pivot analysis, organization chart and other chart functions. The summary is interactive because it is derived from a comparison between customizable variables.
Menu path
Financial/Reports/Balance/P&L/Pivot analysis
Roles & rights
To analyze the financial information, function right 44 – View Indicators Management Overview is required. By default, users with the General manager and Controller roles have this function right.
For more details on what you can do with function rights or levels, go to System/Setup/Security/Function rights, select the required module, and then click on the relevant ID. To find out the functions you can perform with a particular role, go to System/Setup/Security/Roles, type in the description, click Refresh, and then click the required link under the Role column.
Button
Show
Click this to display the report according to the defined criteria.
Note: Once you have clicked this button, the name of the button will change to Refresh.
Refresh
Click this to update the results according to the defined criteria.
Reset
Click this to clear the defined criteria so that you can start a new search.
Close
Click this to exit.
Description
Criteria section
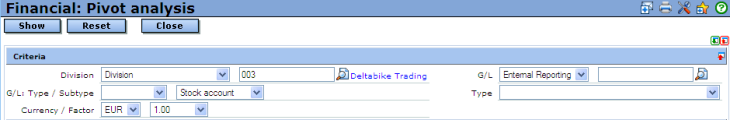
The following criteria are available for the List, Pivot analysis, and Chart analysis types.
Division
Select Division or any other groups to display the relevant details in the pivot analysis report. If Division is selected, type the division name or click  to select the relevant division. If any other groups are selected, click
  to select the subgroup. For more information on creating and modifying divisions, see Creating and Modifying Divisions. For more information on creating and modifying groups, see Creating and Modifying Groups.
G/L
Select up to 10 G/L categories to display the report based on these categories. For more information, see Modifying G/L Account Category.
Note: The categories for selection are dependent on the categories that you have activated at Financial/Setup/Master data/Categories.
You can also select G/L: Division and then type the division name or click  to select the division or range of divisions.
G/L: Type / Subtype
Select the G/L type to display the relevant details in the pivot analysis report. You can choose from B/S (Balance sheet) or Profit and loss (P&L). Leave this option blank if you want details from both G/L types in the report.
At Subtype, select the account type to display the relevant details in the pivot analysis report. You can choose from Asset account, Bank account, Creditor account, and others. Leave this option blank if you want to display details from all subtypes in the report.
Type
Select Standard or Fiscal to determine the type of transaction that you want to display in the pivot analysis report. Leave this option blank if you wish to display both the transaction types.
Currency / Factor
At Currency, select a currency linked to the transactions you want to display in the pivot analysis report. For more information, see Modifying Currency.
At Factor, select the available currency factor for the system to display the amount in the pivot analysis report based on the factor selected. You can choose from 1, 100, 1000, or 1,000,000.
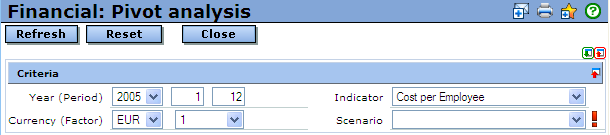
The following criteria are available for the Map analysis type.
Year (Period)
At Year (Period), type a year, and then type a period or range of periods that you want to display for the financial information.
Currency (Factor)
At Currency, select a currency linked to the pivot analysis. Select the available currency factor at Factor for the system to display the amount of pivot analysis based on the factor selected.
Indicator
Select one of the available options to determine which financial information is displayed when you click Show or Refresh. For more information, see Creating Financial Indicators.
Scenario
Select the available budget scenario if you want to display the budgeted or forecasted financial information. For more information on how to create budget scenarios, see Creating Budget Scenario.
Data section

The following criteria are available for the List, Pivot analysis, and Chart analysis types.
Select the available budget scenario if you want to display a budgeted pivot analysis report. For more information on how to create budget scenarios, see Creating Budget Scenario. In addition, you can select (Actual) to display an actual financial pivot analysis report.
Year / Period or Year / Period (Actual + Budget)
At Year and Period, select a year and then type a period or range of periods that you want to display for the pivot analysis report. Another set of period boxes which allows you to type the periods for displaying the pivot analysis report for a range of budgeted periods will be available when you select a budget scenario at Scenario.
Range
Select Date or Reporting date to display the pivot analysis report.
Note: The Range field will be available only if you select (Actual) in Scenario.
Exchange rates: Budget
Click this to display the budgeted exchange rates.
Note: This is displayed only when you select a budget scenario at Scenario. The available exchange rate is displayed if you have defined the budget exchange rates. For more information, see Modifying Currency. At the same time, you also have to make sure that the budget scenario is created and the budgets are allocated accordingly. For more information, see Creating Budget Scenario and Creating Budget Entries.
Compare with section

The following criteria are available for the List, Pivot analysis, and Chart analysis types.
Scenario
To compare the pivot analysis with another budget financial pivot analysis, select the available budget scenario. For more information on how to create budget scenarios, see Creating Budget Scenario. In addition, you can select (Actual) to compare the financial pivot analysis report with another actual financial pivot analysis report.
Note: With the Pivot Analysis functionality, you can compare the actual results of a specific period range with another actual financial report, actual with a budget scenario that includes forecast data, or an actual financial report compared to none. Apart from these, you can also compare the budget report of a specific period range with an actual financial report, a budget report with another budget report of a different period range, or a budget report compared to none.
Year / Period or Year / Period (Actual + Budget)
At Year and Period, select a year and then type a period or range of periods that you want to display for the pivot analysis report. Another set of period boxes which allows you to type the periods for displaying the pivot analysis report for a range of budgeted periods will be available when you select a budget scenario at Scenario.
Range
Select Date or Reporting date to display the pivot analysis report.
Note: The Range field will be available only if you select (Actual) in Scenario.
Exchange rates: Budget
Select this to display the budgeted exchange rates.
Note: This is displayed only when you select a budget scenario at Scenario. The available exchange rate is displayed if you have defined the budget exchange rates. For more information, see Modifying Currency. At the same time, you also have to make sure that the budget scenario is created and the budgets are allocated accordingly. For more information, see Creating Budget Scenario and Creating Budget Entries.
Analysis
You can create four types of analysis on the financial information. The fields available depend on the type of analysis that you select.
 List - Click this to see a group of filters for summarizing requests from a list. Click this again to reset the displayed report.
 Pivot analysis - Click this to see a group of filters for summarizing requests by different variables using a pivot analysis. Click this again to reset the displayed report.
 Map – Click this to see a group of filters for summarizing requests from a map. Click this again to reset the displayed report.
 Chart – Click this to see a group of filters for summarizing requests in other charts. Click this again to reset the displayed report.
List analysis

If you click  List at Analysis, you will see the following fields:
Group by
You can group the list of requests from the available options displayed. A maximum of two different variables can be defined.
Note: Select the check box to sort the two groupings by separate levels.
Values
Select a maximum of two types of values to view the corresponding values of the listed requests. You can select to view the balance, credit, debit, and/or quantity values in the financial pivot analysis report. If you want to compare your report with budgeted data, you should select an option with (Budget) term at the second Values field. Meanwhile, if you want to compare your report with forecast data, you should select an option with (Forecast) term at the second Values field.
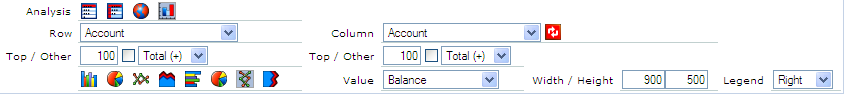
Pivot analysis

If you click  Pivot analysis at Analysis, you will see the following fields:
Row/Top
Select the variable to be used for the rows at Row and then type the number of rows to be displayed at Top.
Value
Select a maximum of two variables to view the values of the defined variables in the financial pivot analysis report.
Column/Top
Select the variable to be used for the columns at Column and then type the number of columns to be displayed at Top.

Click this to switch the options between Row and Column.
Map analysis

If you click  Map at Analysis, you will see the following fields:
Column
Select the variable to be used for the Y-axis.
Map
Select the required map to be displayed.
Value
Select the required value to see the corresponding values of the listed request.
Select  Value,
  Bar,
Bar,  Pie,
Pie,  Pie (Size), or
  Region to view the map in the various formats.
Exclude (Unknown)
Select this check box to exclude the Unknown value, if there is one under Column.
Chart analysis
If you click  Chart at Analysis, you will see the following fields:
Row and Top/Other
Select the variable to be used for comparison at Row and the number of rows to be displayed at Top. If the total number of available information is more than the defined rows at Top, you can lump the balance rows under Other by selecting the check box. For example, select Total (+) or Total (-) to display the totals in ascending or descending order respectively.
Column and Top/Other
Select the variable to be used for comparison at Column and the number of columns to be displayed at Top. If the total number of available information is more than the defined columns at Top, you can lump the balance columns under Other by selecting the check box. For example, select Total (+) or Total (-) to display the totals in ascending or descending order respectively.

Click this to switch the options between Row and Column.
Select  Bar (Vertical),
  Pie (Vertical),
  Line (Vertical), or
  Region (Vertical) to display the result in the various vertical formats.
Select  Bar (Horizontal),
  Pie (Horizontal),
  Line (Horizontal), or
  Region (Horizontal) to display the result in the various horizontal formats.
Value
Select the variable to be displayed in the organization chart.
Width/Height
Type the width and height of the chart.
Legend
Select Right, Bottom, Left, or Top to position the legend at the corresponding location in the chart. Select None if you do not want any legend in the chart. This is not applicable in the Pie format.
Customize
Click  at the title bar to customize the fields or sections. You can add or remove existing criteria based on your preferences by selecting or clearing the relevant check boxes. Click Save to save the settings, Reset to clear the selections, or Close to exit without saving. Take note of the following sections/fields:
Note: This function is not available when you select  at Analysis.
Criteria section
You can define the relevant information on the criteria such as Cost center, Project, Account: Classification, Item: From - To, Type, G/L, and many more.
Related document