Generating graph for financial results
Introduction
You can generate financial reports of your organization in graph form. The bar graph shows the total amounts of all profit & loss accounts. A positive value means profit and a negative value means loss. You can generate the data per week, month or quarter in order to obtain a clear overview of the profit & loss over a certain period.
Menu path
Finance ➔ Reports ➔ Result
Fields
You can set the criteria of the graph you want to display. To generate the graph, you can define one or more of the following criteria and click Start. The graph that matches the defined criteria you have entered is then displayed.
Date/Reporting date
Select Date or Reporting date to display the financial result by entry date or reporting date.
Date/Reporting date
Based on your selection above, the Date/Reporting date option is made available. Select a date range for the entry date or reporting date, or select All for all dates to display the financial results.
General ledger accounts
Select a range for the general ledger accounts, or select All for all accounts to display the financial results.
Unprocessed
Select the this check box to display the data that has not been processed.
Period
Select Week, Month, or Quarter to display the financial results accordingly.
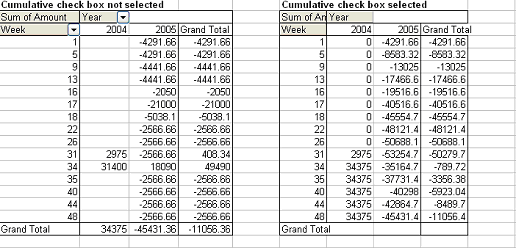
Cumulative
Select this check box to display the cumulative financial results. For example, you select Month and have entered the following:
|
|
2002
|
2003
|
|
January
|
100
|
700
|
|
February
|
300
|
225
|
|
March
|
500
|
425
|
The cumulative amount in month 3 of 2003 is then 1350 (700 + 225 + 425). The entries in 2002 do not count. If a date range has been specified, the calculation is not made from the beginning of the relevant financial year but from the beginning of the date range. If, in this example, the date range is 1 February 2003 to 31 March 2003 , the cumulative amount in month 3 of 2003 is 650 (225 + 425).
Note: The screen below (that is generated when the Start button and Table tab are clicked) shows the difference in data when the Cumulative check box is selected and when it is cleared. Both the data does not appear on the same screen but have been merged for explanation purpose.
Budget scenario
Type or select a budget scenario. This option is only available if Month is selected at Period and if you have the E-Budget module. In the graph, the budgeted amount per month (according to this budget scenario) is included as additional information.
Buttons
Start
Click this to generate the financial results graph.
Note: You can click on the Graph, Table and Data tabs at the bottom of the screen to view different presentations of the same data.
Close
Click this to exit.
Related documents
| Main Category: |
Attachments & notes |
Document Type: |
Online help main |
| Category: |
|
Security level: |
All - 0 |
| Sub category: |
|
Document ID: |
12.571.651 |
| Assortment: |
Exact Globe+
|
Date: |
26-09-2022 |
| Release: |
|
Attachment: |
|
| Disclaimer |